
Contents
Overview
Cost Alert notifies you by email when your cloud spend exceeds a threshold you define. Combine an aggregation period (Daily / Weekly / Monthly / Yearly), an alert condition (ratio or absolute amount), and an alert target (CSP, filters, Group by) to monitor exactly the scope of cost you care about.
When an alert fires, the Alert Events screen shows which targets exceeded the threshold and how the cost trended. If the AI Analysis Report is enabled, AI analyzes the causes of the increase and recommended actions, delivered both by email and on screen.
Service Scope
| Menu | CSP | Alert Condition | AI Analysis Report |
|---|---|---|---|
| Cost Management > Cost Manager > Alert Settings > Cost Alert Settings / Cost Alert Events | CSPs in use on the account, such as CloudZ, AWS, Azure, Azure EA, GCP, and Naver Cloud | Ratio (against a reference amount) / Absolute (amount) | O |
- The CSP selector lists only CSPs that have billing data on the account. Selecting All evaluates the combined cost of every CSP.
- Cost data takes up to 3 days to be collected, so alerts are evaluated once a day against the most recently collected data.
Using Cost Alert
1. Alert List
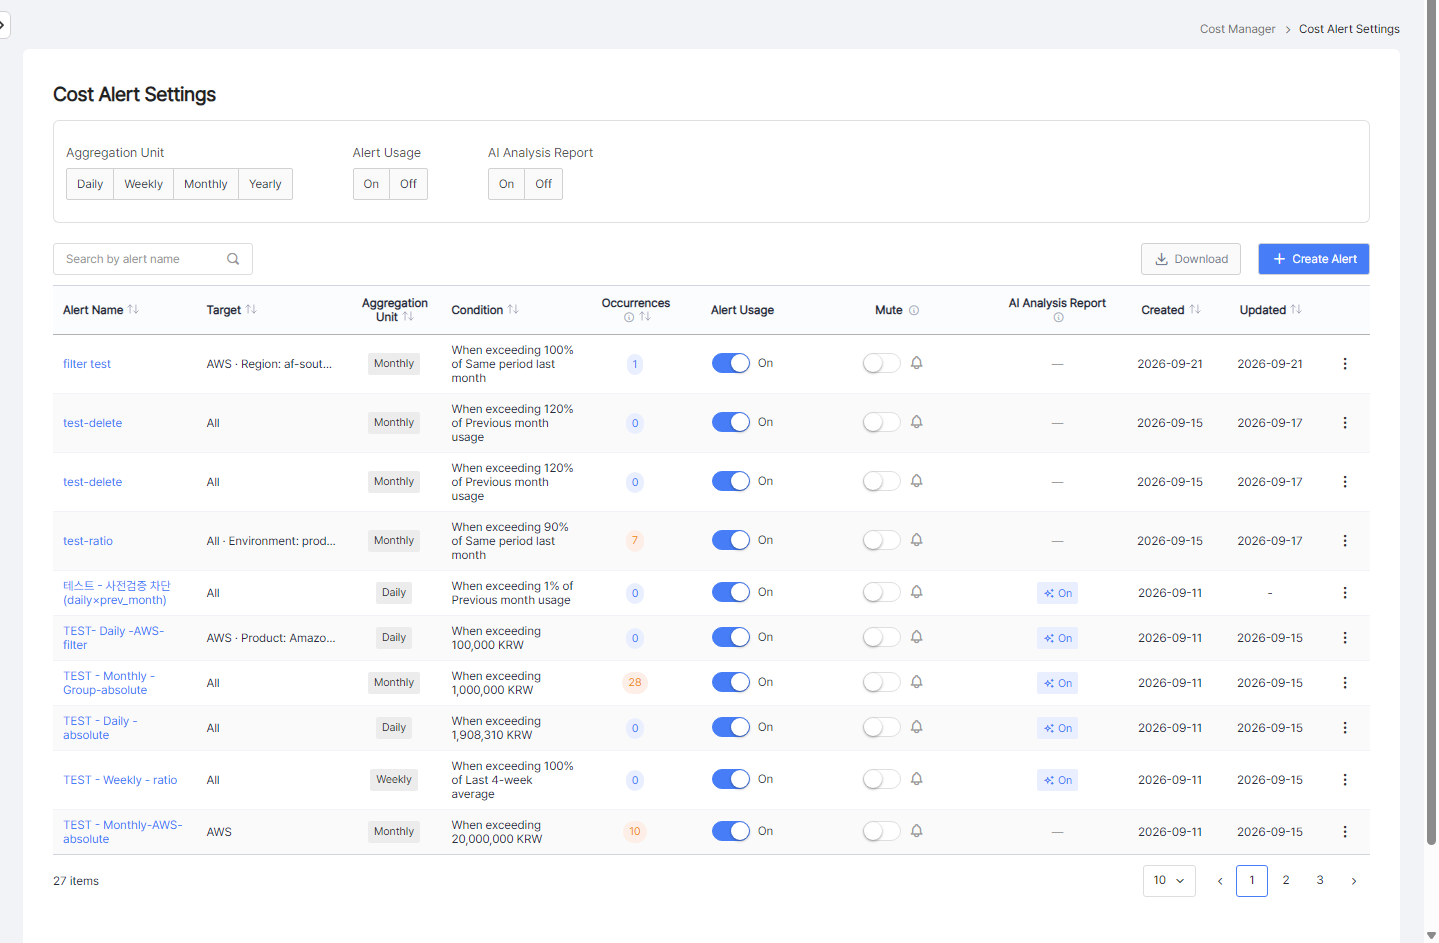
Open Alert Settings > Cost Alert Settings in the left menu to review the alerts you created and manage whether they are enabled or muted.
- Filters — Narrow the list by aggregation period (Daily / Weekly / Monthly / Yearly), whether the alert is enabled, and whether the AI Analysis Report is enabled. You can also search by alert name.
- Alert Target — The CSP and filter conditions (region, product, tags, and so on) the alert monitors.
- Alert Condition — The evaluation rule in plain words (for example, "Exceeds 120% of last month's usage" or "Exceeds 1,000,000 KRW").
- Alerts Triggered — How many times the alert fired within the current aggregation period. For group alerts, this is the number of combinations that exceeded the threshold.
- Enabled — Turn the toggle off to stop evaluating the alert.
- Mute — The alert keeps running, but email and AI Analysis Report delivery pauses for the period you set.
- Download — Export the current list as an Excel file.
- Create Alert — Opens the screen for creating a new alert. Click an alert name to open it for editing.
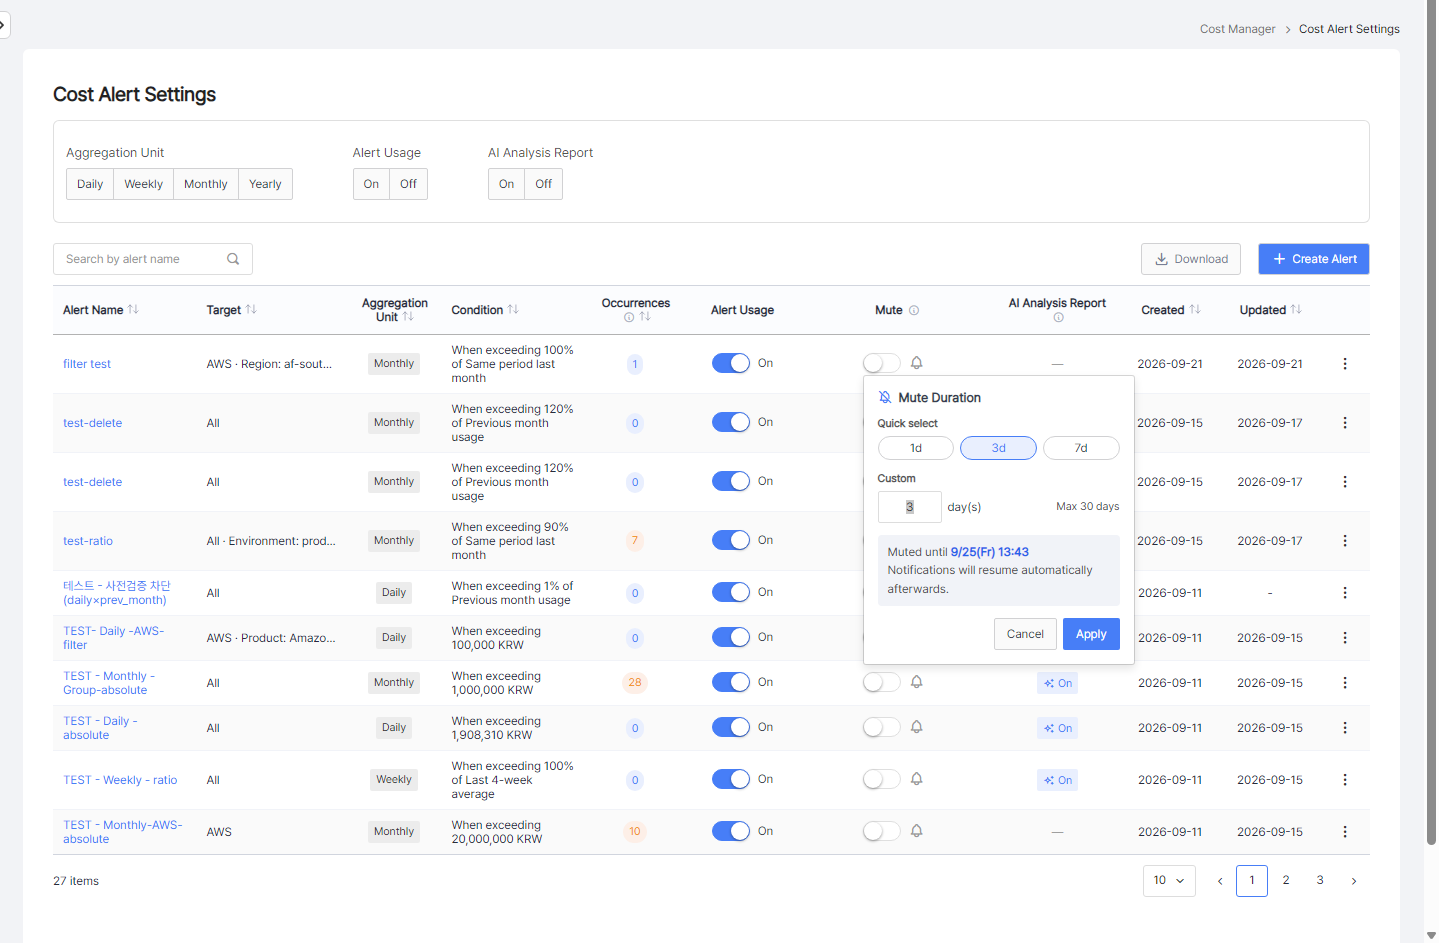
- Mute Period — Turning the toggle on opens the mute period popover. Choose a quick option (1 / 3 / 7 days) or enter a value (up to 30 days), then click [Apply] to start muting.
- Alert history is still recorded while muted, and notifications resume automatically after the end time.
2. Creating an Alert
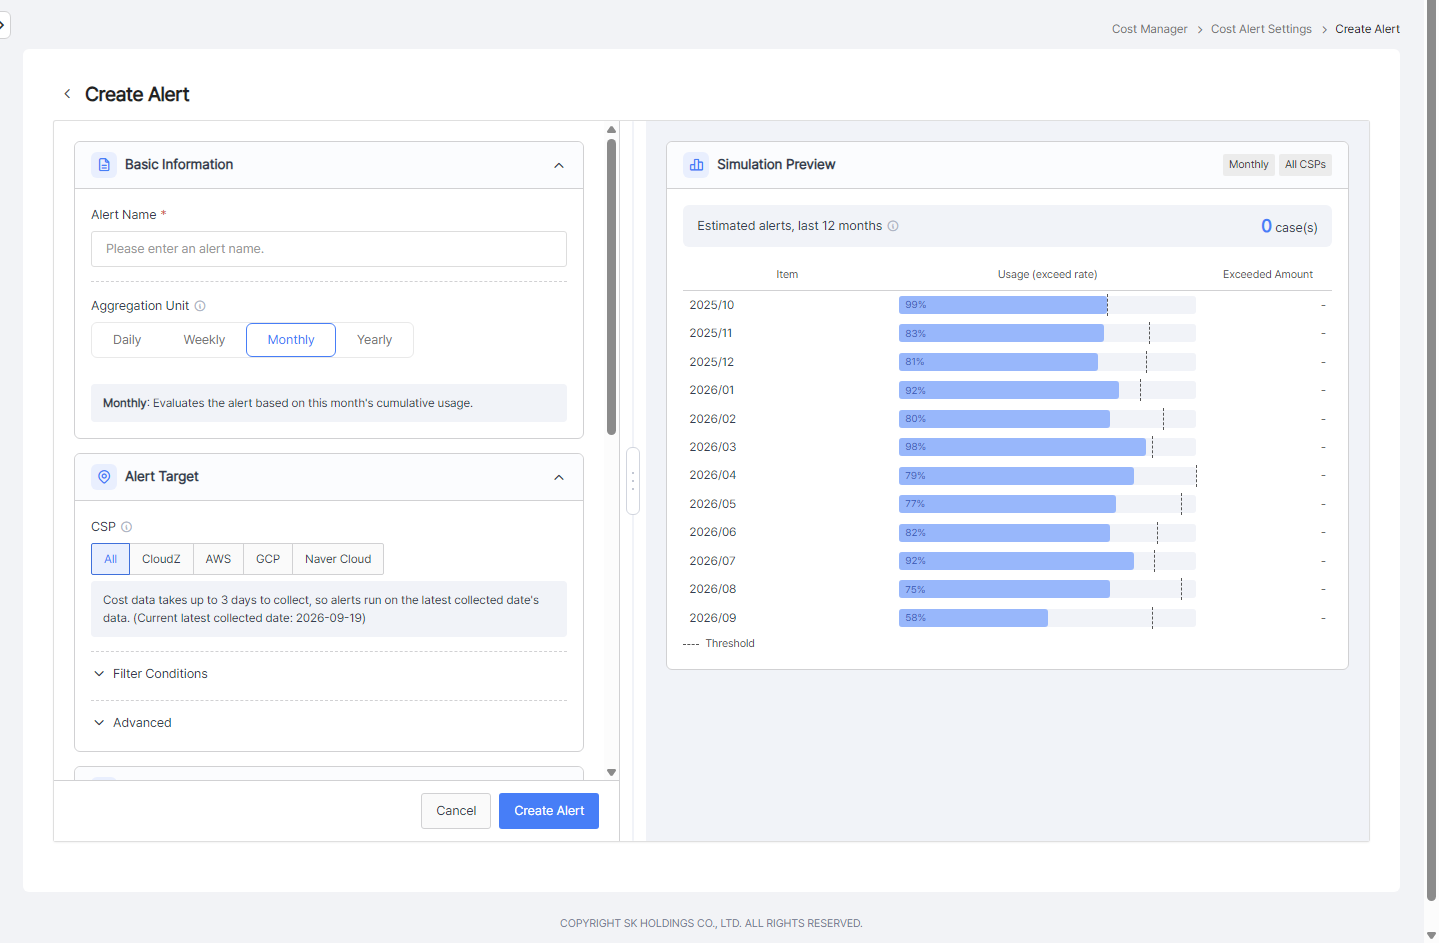
As you fill in the alert settings on the left, the Simulation Preview on the right refreshes immediately with real cost data.
Basic Information
- Alert Name — The name shown in the list and in emails. Two alerts cannot share the same name.
- Aggregation Period — The period over which cost is summed. Daily evaluates a single day's usage, Weekly the cumulative amount for the current week (from Monday), Monthly the cumulative amount for the current month, and Yearly the cumulative amount for the current year.
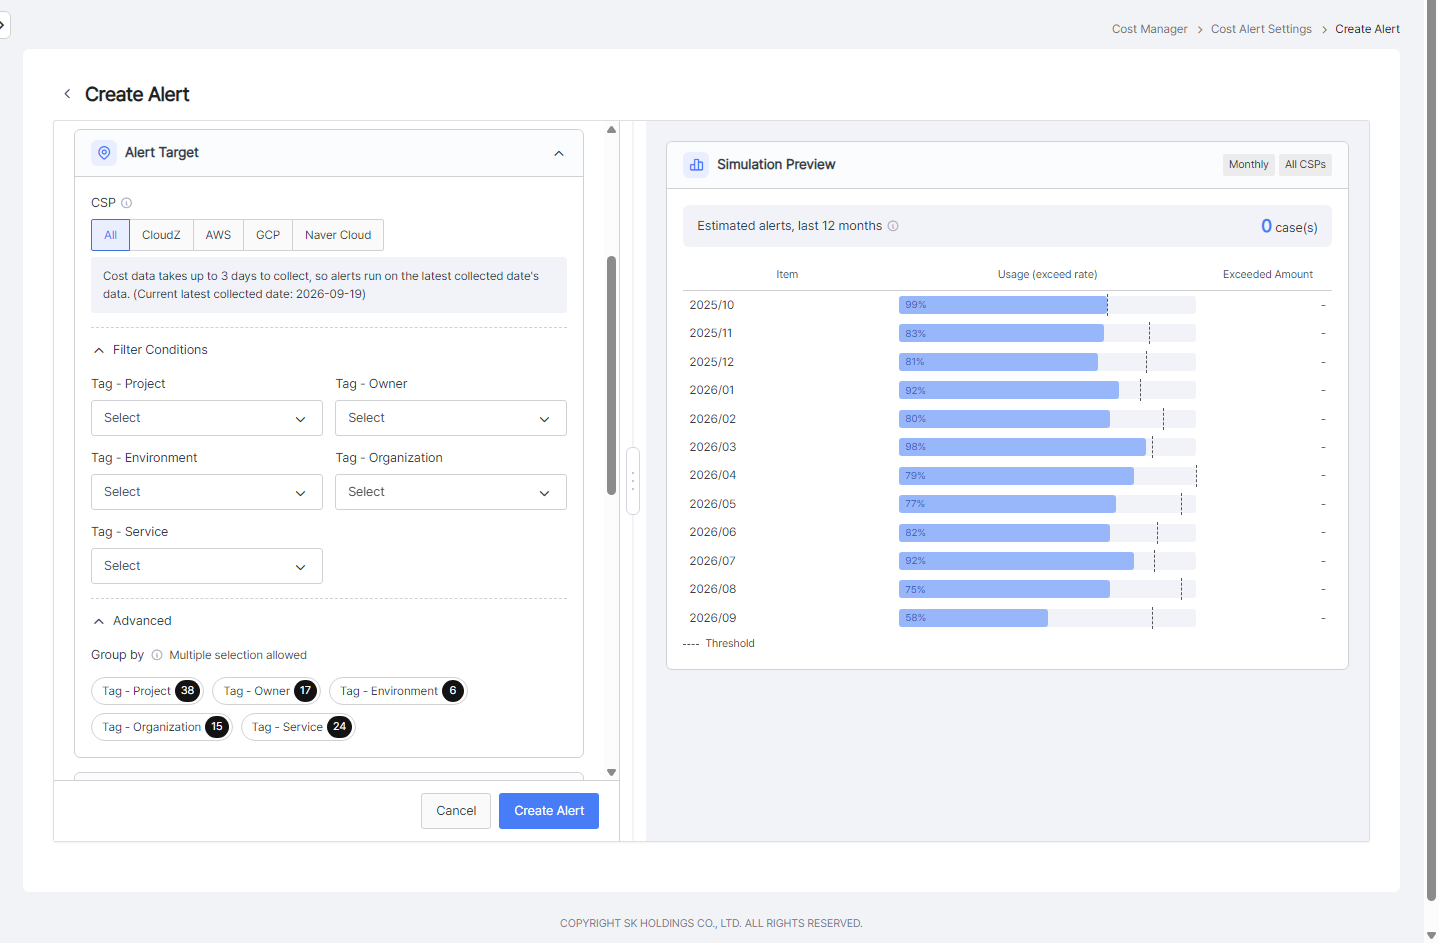
Alert Target
- CSP — Choose a single CSP to monitor, or All for every CSP.
- Filter Conditions — Narrow the scope using the items available for each CSP, such as region, product, resource group, and tags. Without filters, the alert monitors the full cost of the selected CSP.
- Advanced > Group by — Splits cost by every value combination of the selected dimensions (tags, products, regions, and so on) and evaluates each one separately. For example, grouping by Tag - Environment raises separate alerts for prod, dev, and so on. The number next to each dimension is the current combination count; an alert cannot be created if the combinations exceed 1,000.
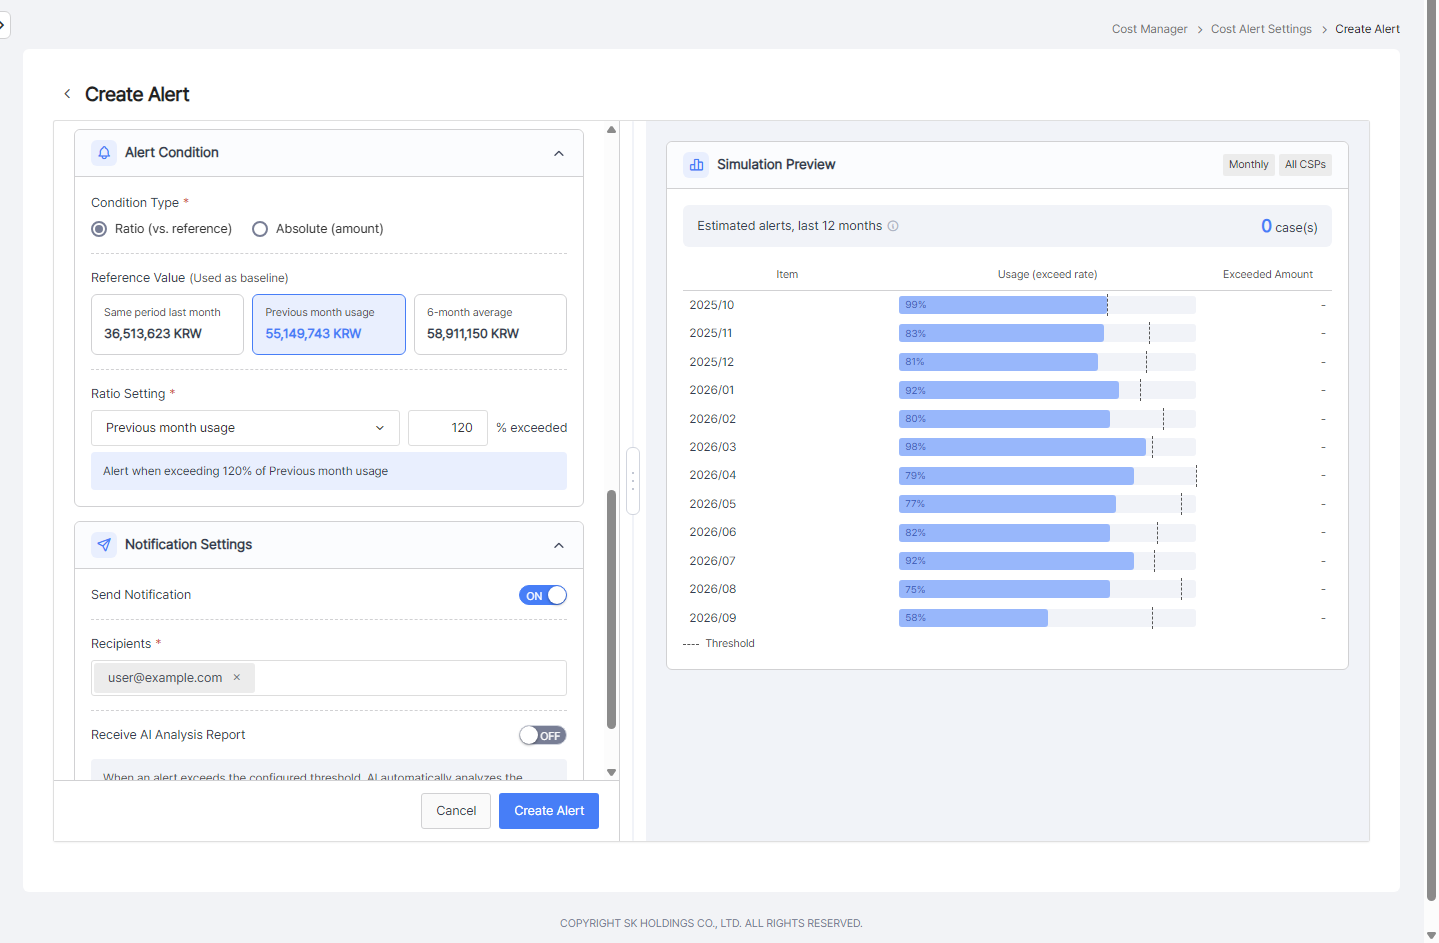
Alert Condition
- Ratio (against a reference) — Fires when cost exceeds a percentage of the comparison amount. The comparison base depends on the aggregation period: previous day / 7-day average (Daily), previous week / 4-week average (Weekly), previous month / same period last month / 3-month and 6-month average (Monthly).
- Reference Values — Cards show the actual amount for each comparison base to help you choose a threshold.
- Absolute (amount) — Fires when the cumulative usage for the period exceeds the amount you enter. Yearly alerts support the absolute condition only.
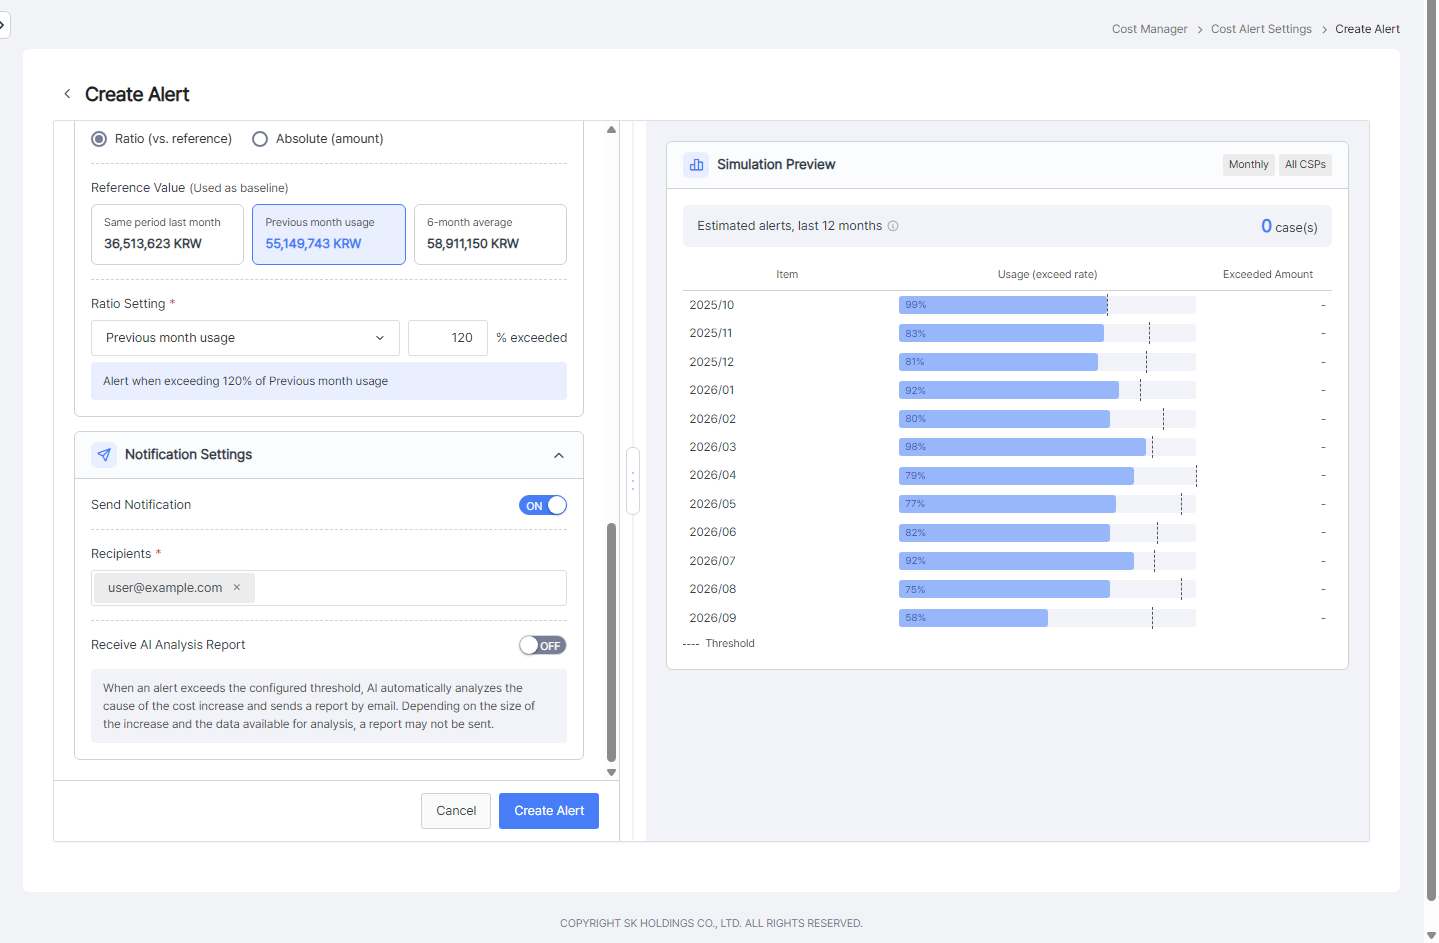
Notification Settings
- Send Notification — Whether to send an email when the alert fires.
- Recipients — You can register multiple email addresses.
- Receive AI Analysis Report — When enabled, AI automatically analyzes the causes of the cost increase whenever the alert fires and sends the report by email. Depending on the size of the increase and the data available, a report may not be sent.
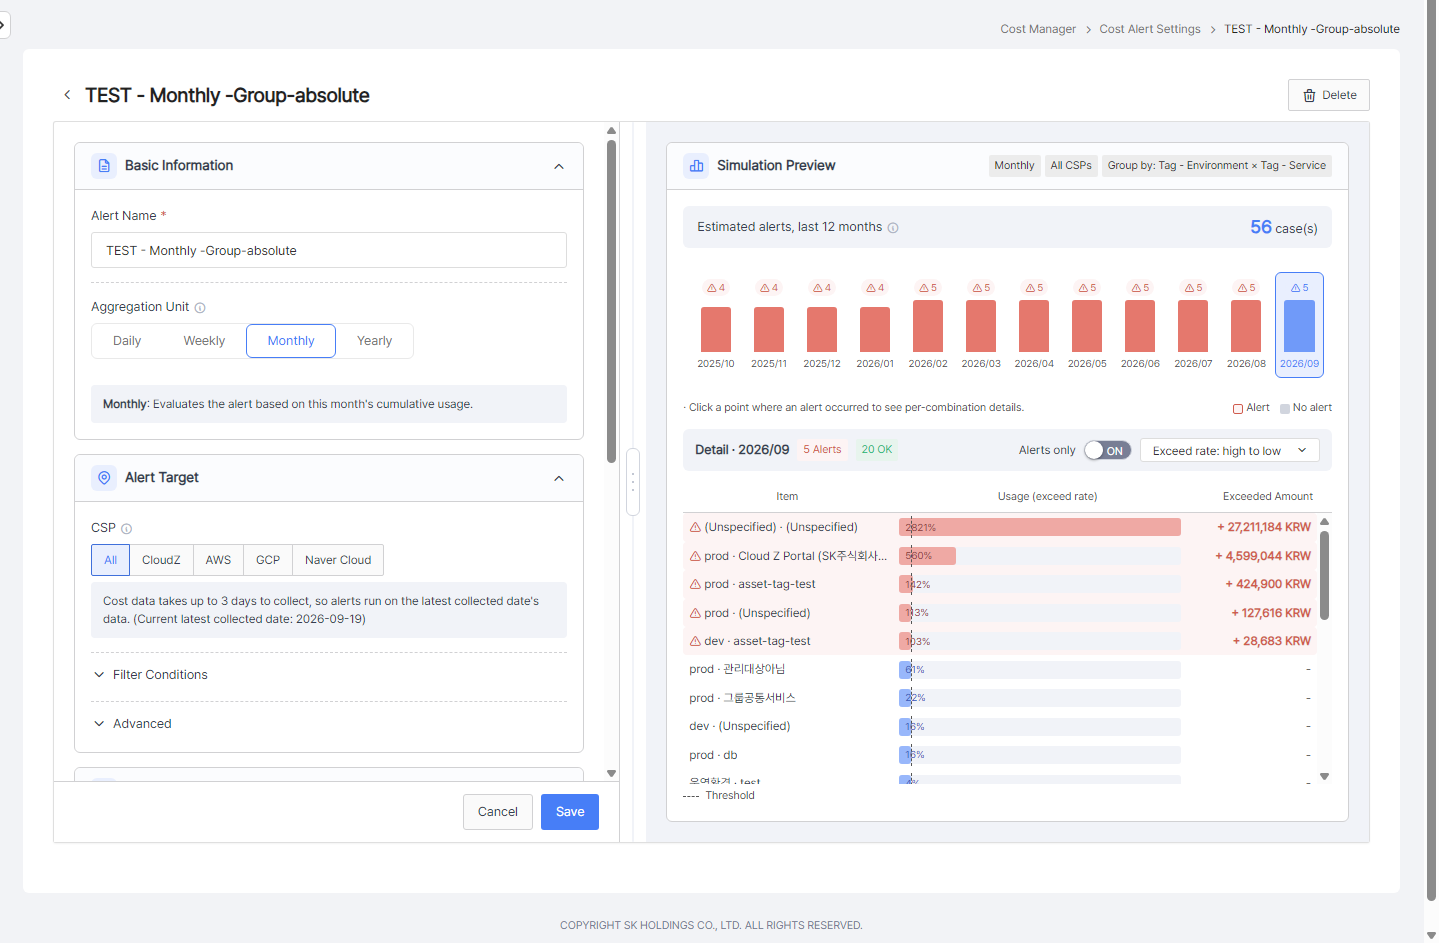
Simulation Preview
- Expected alerts over the last 12 months — How many times the alert would have fired if the current conditions had been applied to the past 12 aggregation periods.
- Usage (exceed rate) — Usage per period as a percentage of the threshold. Periods that exceeded the threshold are shown in red.
- Group by alerts — Bars show how many combinations fired in each period. Click a bar to see the usage and excess amount of each combination in the Detail table below. Resources without the tag are aggregated as the (Unspecified) combination.
3. Alert Events
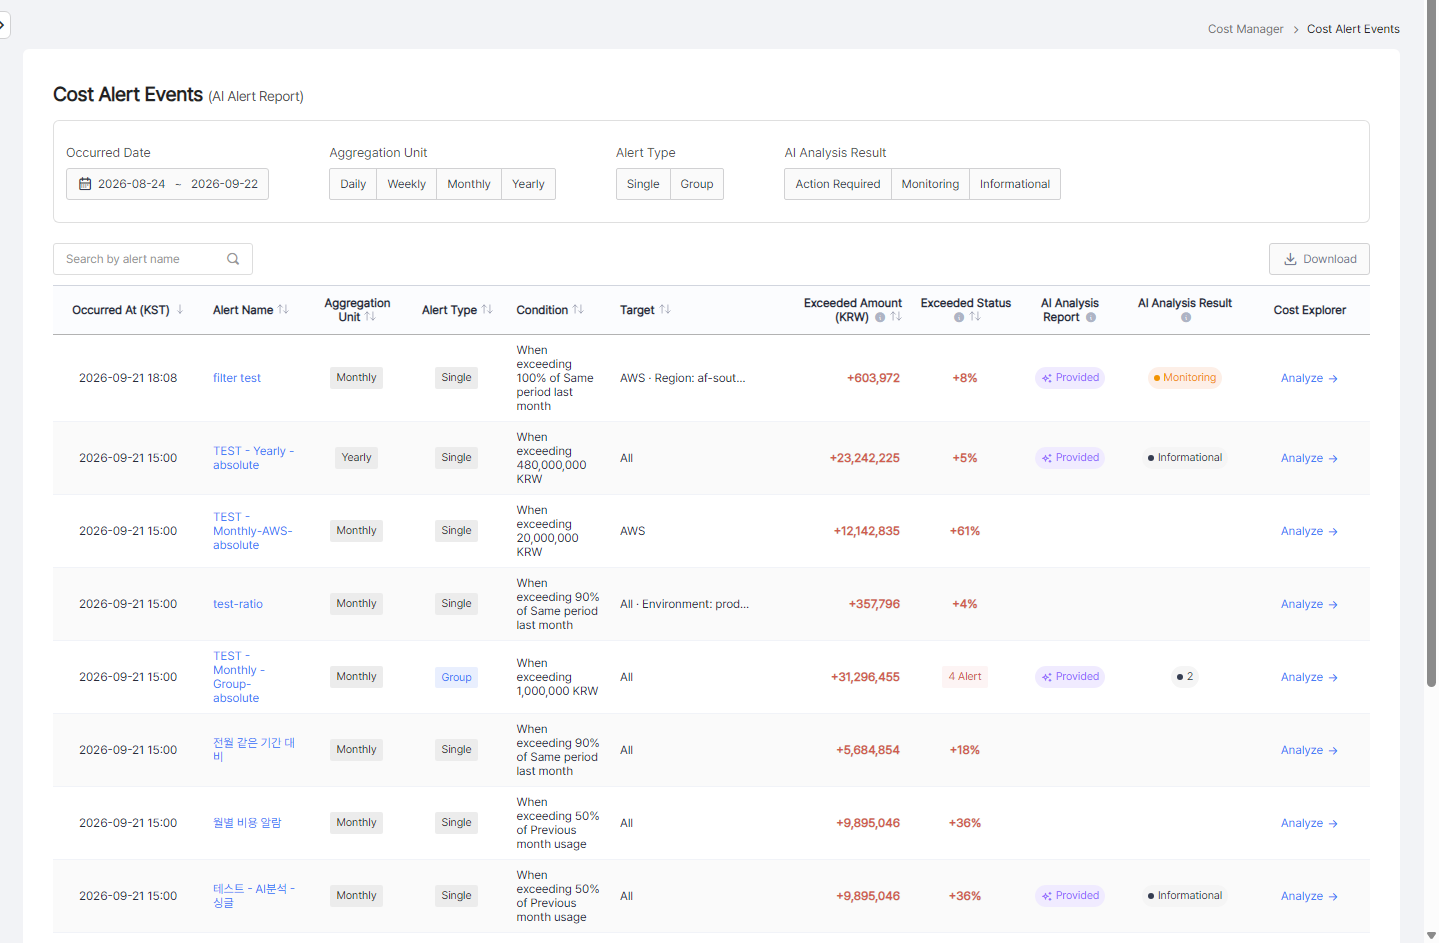
Review the history of alerts that actually fired. Open Alert Settings > Cost Alert Events in the left menu.
- Filters — Narrow events by occurrence date range, aggregation period, alert type (Single / Group), and AI analysis result (Action Required / Monitor / Informational).
- Excess Amount / Excess Rate — The amount and percentage above the threshold. Group alerts show the number of combinations that exceeded (N Alert).
- AI Analysis Report — Events with a generated report show a "Provided" badge.
- AI Analysis Result — The report's verdict. Single alerts show a verdict badge; group alerts show the verdict counts across combinations.
- Cost Explorer Analyze — Opens Cost Explorer in a new tab with the alert conditions (CSP, filters, period) already applied.
- Click an alert name to open the event details.
4. Event Details
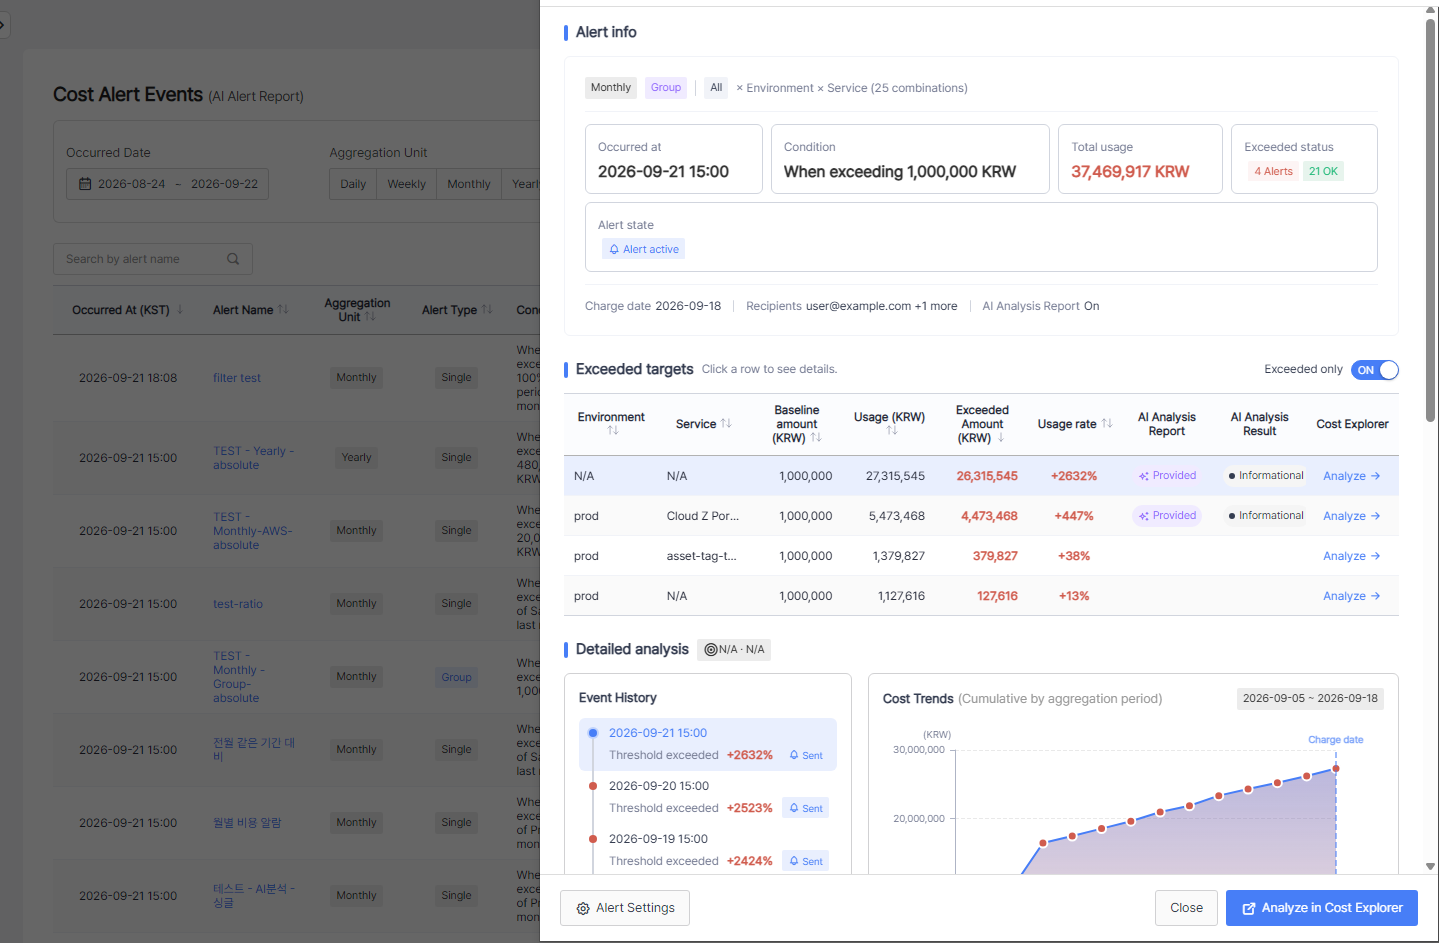
- Alert Information — Occurrence time, alert condition, total usage, excess status, alert status (whether sent), plus the charge date, recipients, and whether the AI Analysis Report is enabled. The charge date is the last date of cost data used for the evaluation.
- Exceeded Targets — A table of the targets that exceeded the threshold. Group alerts show the base amount, usage, excess amount, and usage rate per combination; turn off the "Triggered only" toggle to see combinations that did not exceed as well. Resources without the tag are shown as N/A.
- Analyze per row — Opens Cost Explorer in a new tab filtered to that combination only.
- Click a row to switch the Detailed Analysis and AI Analysis Report below to that combination.
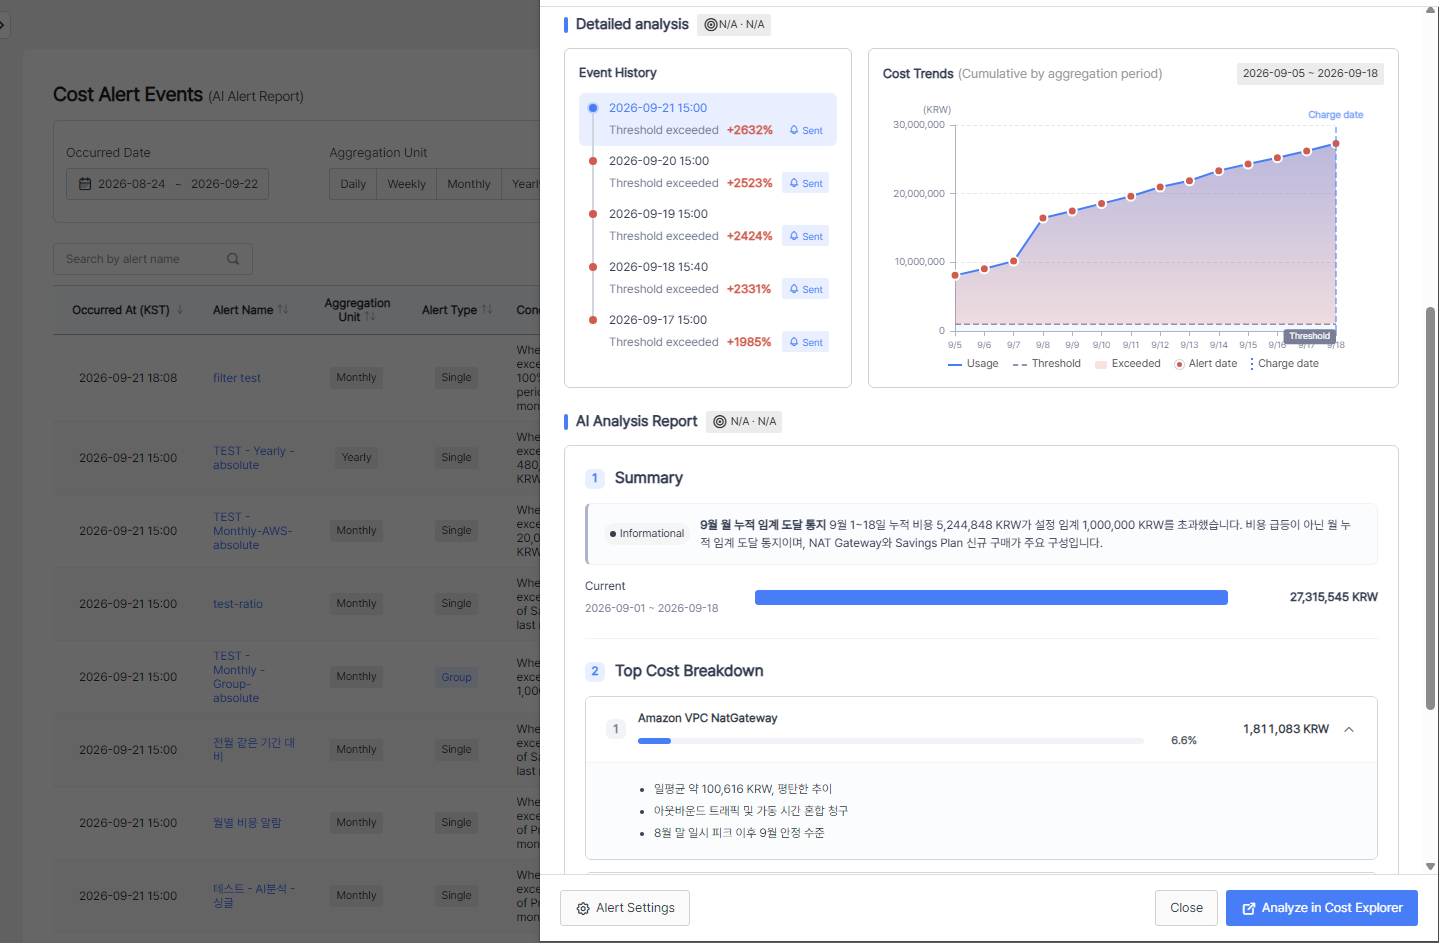
- Event History — Recent occurrences of the same alert with their excess rate and delivery status.
- Cost Trends — Usage over the last 14 days up to the charge date. The blue line is the cumulative usage within the aggregation period, the gray dashed line is the threshold, and days that exceeded the threshold are marked with red dots and a shaded excess area.
- Footer buttons — "Alert Settings" opens the alert for editing; "Analyze in Cost Explorer" opens Cost Explorer with the full alert conditions applied.
5. AI Analysis Report
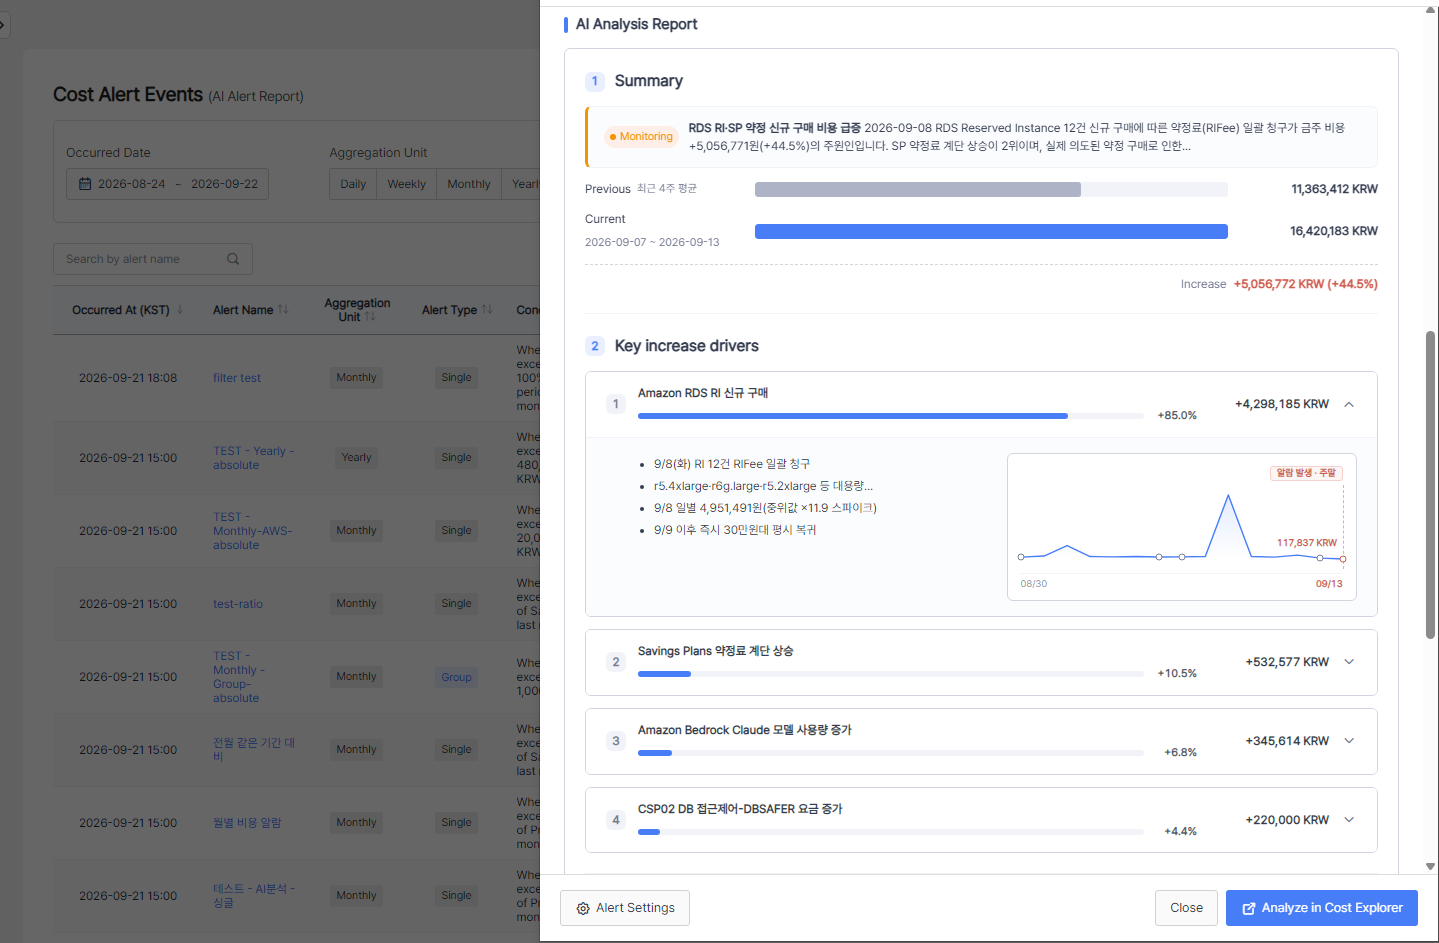
For alerts with "Receive AI Analysis Report" enabled, AI analyzes the causes of the cost increase whenever the alert fires. The report appears at the bottom of the event details and in the email.
- Summary — A verdict badge (Action Required / Monitor / Informational), a one-line summary, and a comparison of usage in the previous and current periods.
- Key Drivers — Causes listed by the size of the increase, with their contribution. Expand an item to see the supporting details and a daily variation chart for the period. Absolute alerts show "Cost Breakdown" instead.
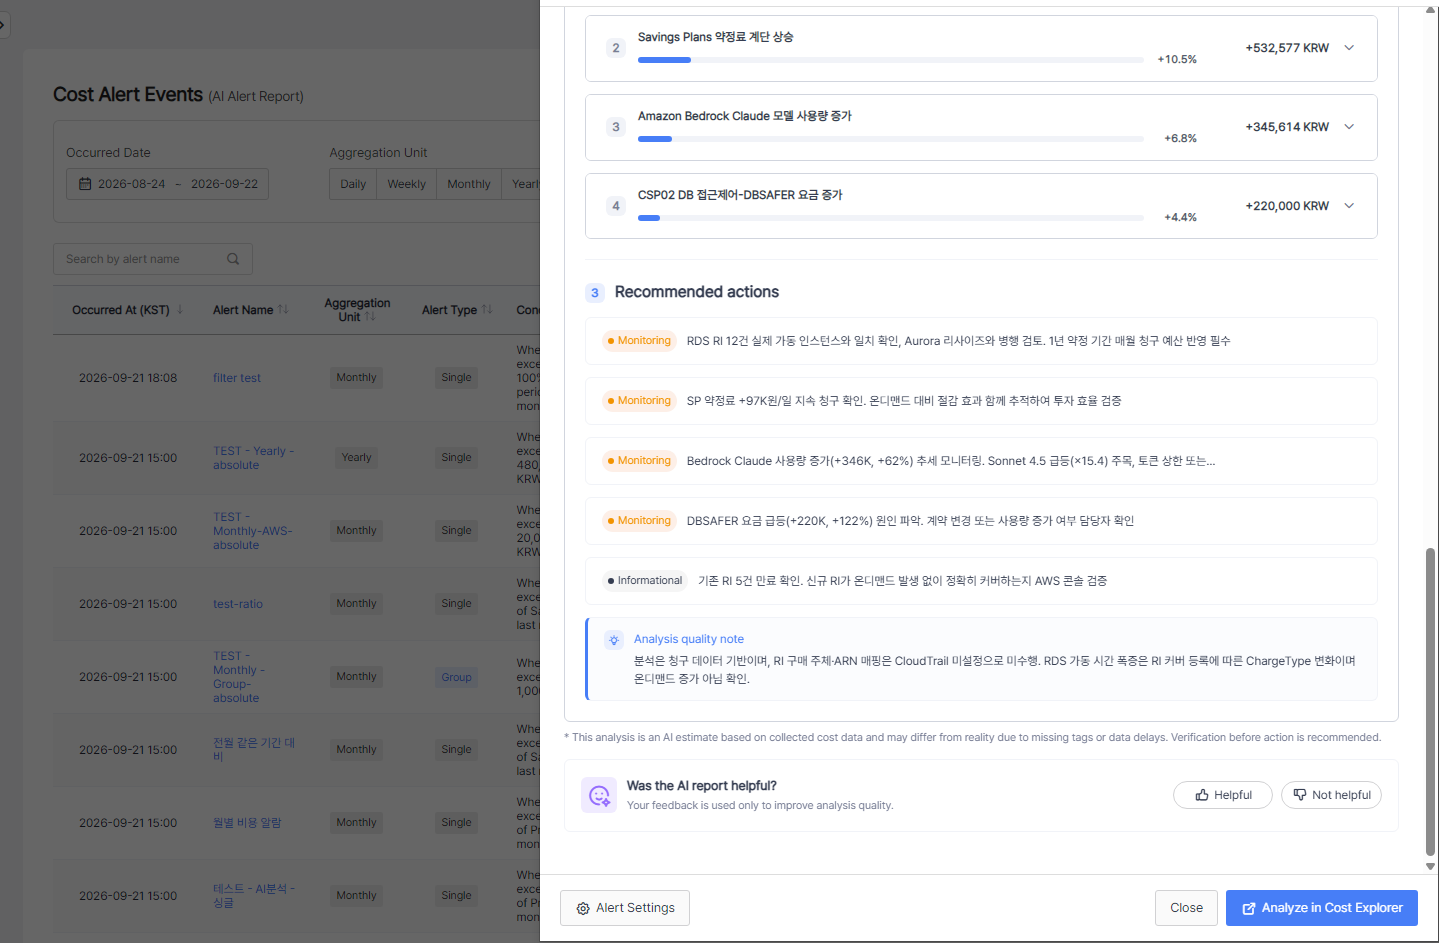
- Recommended Actions — What to check or do, labeled by verdict.
- Analysis Quality Note — Explains any limitations, such as missing data or estimates.
- Feedback — Rate the report with "Helpful / Not helpful". Ratings are used only to improve analysis quality.
AI analysis is an estimate based on the collected cost data, so we recommend confirming actual usage before taking action.
6. Email Notifications
- When an alert fires, registered recipients receive an email with the alert name, alert condition, usage, and excess status.
- For alerts with the AI Analysis Report enabled, the email includes the report summary and recommended actions, and the "View full AI Alert Report" button opens the event details directly.
- While an alert is muted, only the alert history is recorded; no email or AI Analysis Report is sent.
Online consultation
Contact us