Overview
The accessible Kibana menus vary depending on the permissions granted to the Project Role (Admin/Editor/Viewer).
SystemAdmin | Admin | Editor | Viewer | |
|---|---|---|---|---|
Discover | Full access | Full access | Full access | Can view logs Cannot save viewed logs (Save button not available) |
Dashboard | Full access | Full access | Full access | No access |
Visualize | Full access | Full access | Full access | No access |
Query Workbench | Has full access but not planned to use | No access | No access | |
Alerting | No access | No access | ||
Anomaly Detection | No access | No access | ||
Notebooks | No access | No access | ||
Dev Tools | Full access | Full access to the project's indexes | No access | No access |
Index Management | Full access | Full access to the project's indexes | No access | No access |
Stack Management | Full access | Full access to the project's indexes | View, edit, and delete permissions No permission to create index patterns | View only permission No permission to edit or delete |
Security | Visible with full access | Not visible | Not visible | Not visible |
How to Access Kibana
Select the Logging Menu from the console

How to Change Tenants
Click the icon in the upper right corner of Kibana to view account information and related menus.
Among them, select the “Switch tenants” menu to change the tenant.
There are three main types of tenants:
global - (1)
This is a public tenant accessible by all users.
Private - (2)
This tenant is accessible only by the logged-in user.
Choose from custom - (3)
You can select custom tenants that you have access to.
Main Menus of Kibana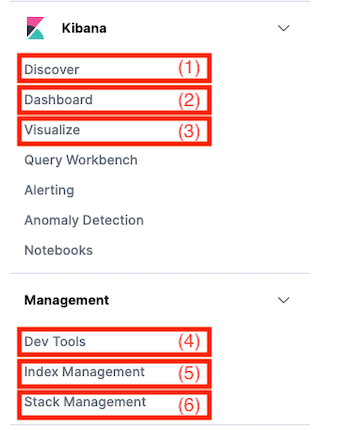
Discover - (1)
Project Role Permissions: Admin, Editor, Viewer
This screen allows you to view logs.
Reference Document: https://www.elastic.co/guide/en/kibana/7.9/discover.html
Search input area - (1-1)
You can enter keywords to filter logs retrieved within the selected time period.
You can search for specific words (e.g., error) or logs that contain specific key-value pairs.
Example keywords: error, request_method: POST
Time range selection area - (1-2)

Selecting the calendar displays a quick menu for setting the time range.
The default is from the last 15 minutes to now (Last 15 minutes).
You can select ranges such as the last 15 minutes, 30 minutes, 1 hour, 1 day, 1 week, or 1 month.
At the bottom, under Refresh every, you can set the interval for auto-refreshing logs and start/stop it as needed.
Clicking the selected time range on the right allows you to set the From~To range using Absolute, Relative, or Now options.
Absolute: Used to select an exact time.
Relative: Used to select a relative time range.
Now: Used to select the current time.
Refresh button - (1-3)

This button allows you to re-fetch the data based on the configured time and filters.
Filter button - (1-4)

Applies filters using Field values for the selected time range.
Selecting the Field combo box allows you to choose fields from the logs.
Select an operator and input a value to apply the filter.
Index-pattern selection and display area - (1-5)
Shows or allows selection of the index-pattern for logs to view.
Initially, the default index-pattern is shown. After that, the combo box lets you switch patterns.
Selected field values in log summary - (1-6)
Hover over the desired field under the Available fields section and click the “Add” button to include it in the summary.
It will appear in the Selected fields section and be displayed in the summary view.
To remove it, hover over the field and click the “Remove” button.
Dashboard - (2)
Project Role Permissions: Admin, Editor
Displays multiple visualizations in panels for a consolidated view of information.
Reference Document: https://www.elastic.co/guide/en/kibana/7.9/dashboard.html
The following is a sample dashboard.
Visualize - (3)
Project Role Permissions: Admin, Editor
Allows you to visualize logs in various forms.
Reference Document: https://www.elastic.co/guide/en/kibana/7.9/visualize.html
Lens: Drag and drop the desired data fields to quickly build various types of basic visualizations.
Most frequently used visualizations
Line, area, and bar charts — Compare multiple series in an X/Y chart.
Pie chart — Show each source's contribution to the total.
Data table — Merge aggregations into a table format.
Metric — Display a single number.
Goal and gauge — Display numbers with progress indicators.
Tag cloud — Display words in a cloud where size indicates importance.
TSVB : Visualize time series data using pipeline aggregations.
Timelion : Calculate and combine data from multiple time series datasets.
Maps : Display geospatial data in Kibana.
Heat map : Display shaded cells within a matrix.
Markdown widget — Display free-form information or instructions.
Controls — Add interactive inputs to dashboards.
Vega : Provides complete control over queries and display.
Below is a Visualize sample.
Dev Tools - (4)
Project Role Permissions: Admin (only for Project Index)
This screen allows you to call REST APIs and view the results.
Reference Document: https://www.elastic.co/guide/en/kibana/7.9/devtools-kibana.html
Index Management - (5)
This is the screen for managing indices.
Index Policies - (1)
This screen allows you to create/edit/delete policies for managing indices.
Managed Indices - (2)
This screen allows you to modify/delete/retry indices that have policies applied.
Indices - (3)
Displays stored indices. You can apply a created index policy to an index.
Stack Management - (6)
Project Role Permissions: Admin (only for Project Index), Editor (partial), Viewer (partial)
This is the screen for managing Kibana settings and more.
Index Patterns - (1)
Index Patterns define the indices to be referenced in Kibana queries. This screen allows you to create and view index patterns.
How to create an Index Pattern:
First, click the "Create index pattern" button on the top right.
Second, group the indices you want to include into a pattern. (Example: security-auditlog-*)
Third, set the time field to base log queries on, then click "Create index pattern" to finish.
Saved Objects - (2)
This screen shows the saved objects used in Kibana.
Advanced Settings - (3)
This screen shows various Kibana settings, which can also be modified.
Online consultation
Contact us