
목록
Overview
Compute SP Analyzer analyzes your actual hourly compute usage over a selected period, visualizes the coverage and savings of your current RI/SP, and recommends the optimal additional Compute Savings Plans commitment ($/hour) that maximizes the discount without overcommitting.
When your existing RI/SP are about to expire, or when you are purchasing Savings Plans for the first time, you can simulate “how much to commit for the best result” based on your real usage pattern.
Service Coverage
| Menu | CSP | Service | Compute SP Analysis |
|---|---|---|---|
| Compute SP Analyzer | AWS | EC2 | O |
| Compute SP Analyzer | AWS | Fargate (ECS / EKS) | O |
| Compute SP Analyzer | AWS | Lambda | O |
The analysis targets AWS compute resources eligible for Compute Savings Plans, and also reflects your existing RI, EC2 Instance SP, and Compute SP holdings.
Using Compute SP Analyzer
1. Period of Use & Base Rate

- Base rate — Shows the currency, exchange rate, and reference month actually applied to on-screen amounts (e.g., USD/KRW).
- Period of use — Set the analysis period via the 7D / 14D / 30D presets or a custom selection.
- Data is based on the cloud usage period (not the billing period) and is collected up to D-4 only.
2. Overview Dashboard
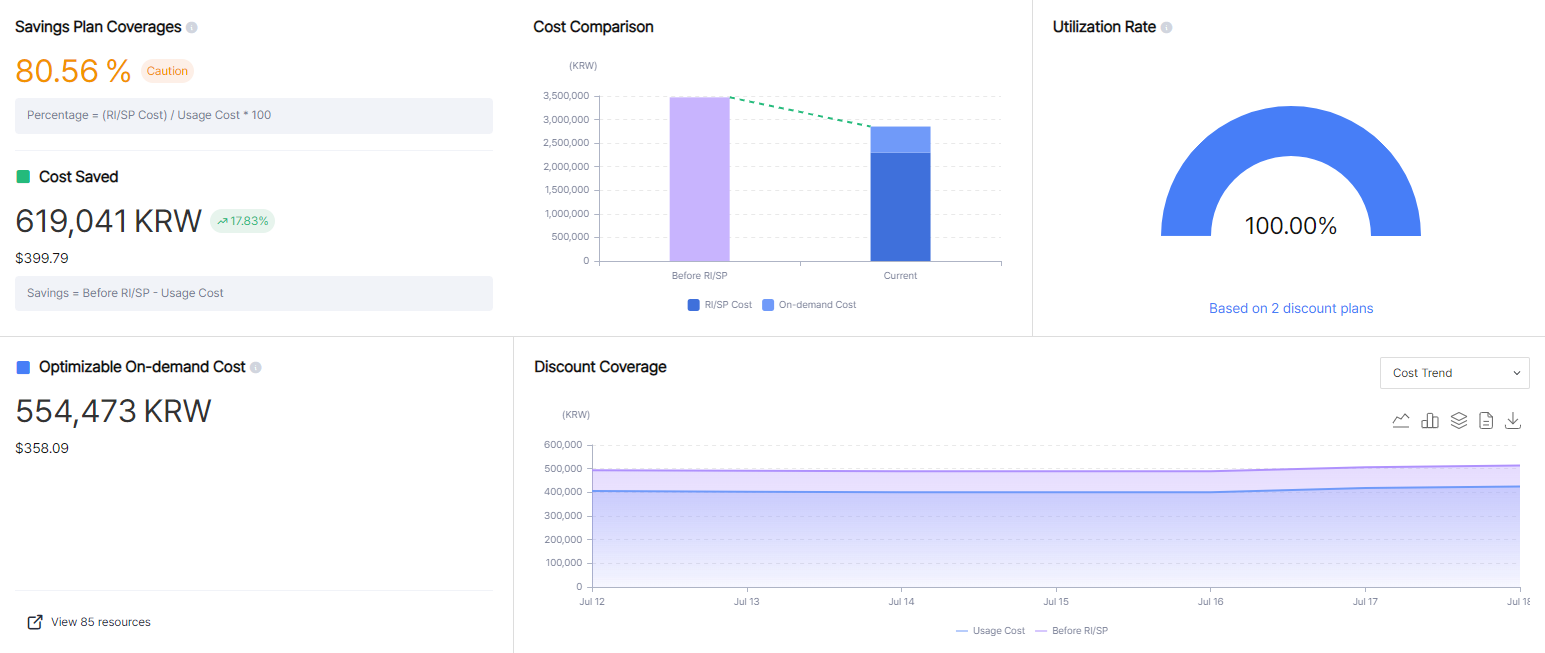
See the savings effect of your current RI/SP and the remaining optimization opportunity at a glance.
- Savings Plan Coverages — Share of the total billed cost covered by RI/SP —
(RI/SP Cost) / Usage Cost × 100 - Cost Saved — Amount saved by applying RI/SP —
Before RI/SP − Usage Cost - Cost Comparison — Compares the cost before RI/SP (Before RI/SP) with the current cost (Current)
- Utilization Rate — Average rate at which your currently owned RI/SP commitments are actually used
- Optimizable On-demand Cost — On-Demand cost that could be further reduced with an additional discount plan. Use
View resourcesto inspect per-resource-ID details (usage, rate, coverage, etc.). - Discount Coverage — Daily cost trend viewed as Cost Trend / Cost Structure / Net Savings
3. Compute SP Simulation
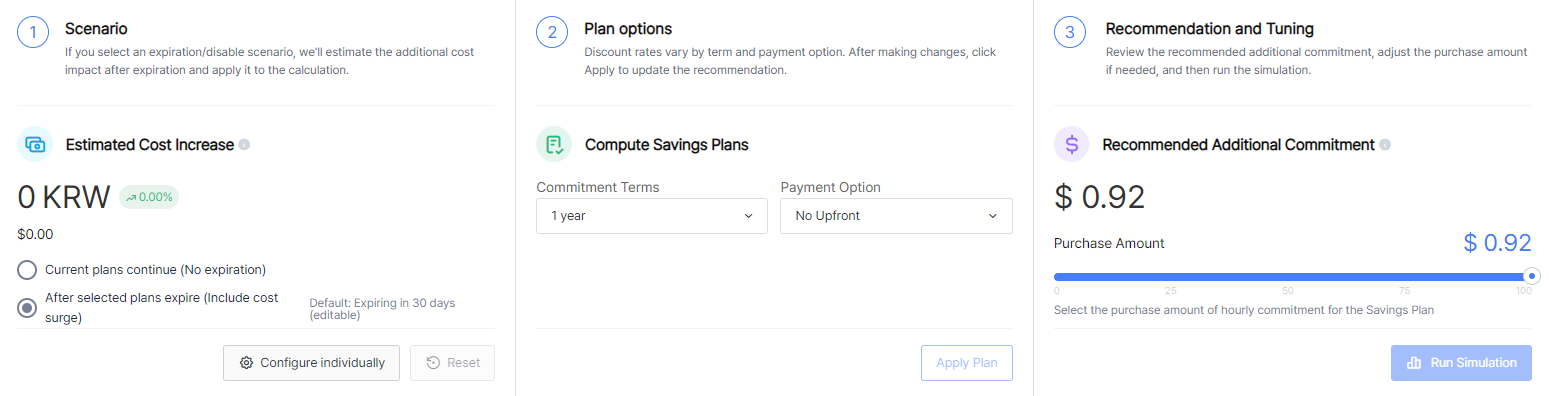
- Step 1. Scenario
- Choose
Current plans continue(no expiration) orAfter selected plans expire(include cost surge). - Use
Configure individuallyto filter and select the RI/SP to expire by group, category, utilization, etc. - Estimated Cost Increase — Shows the additional cost expected when the selected plans expire.
- Choose
- Step 2. Plan Options
- Select the
Commitment Terms(1 year / 3 years) andPayment Option(No Upfront / Partial Upfront / All Upfront). - Click
Apply Planafter changes to refresh the recommendation.
- Select the
- Step 3. Recommendation and Tuning
- Recommended Additional Commitment — Recommends the optimal hourly commitment based on your usage pattern.
- Adjust the purchase amount with the
Purchase Amountslider, then clickRun Simulation.
4. Simulation Results
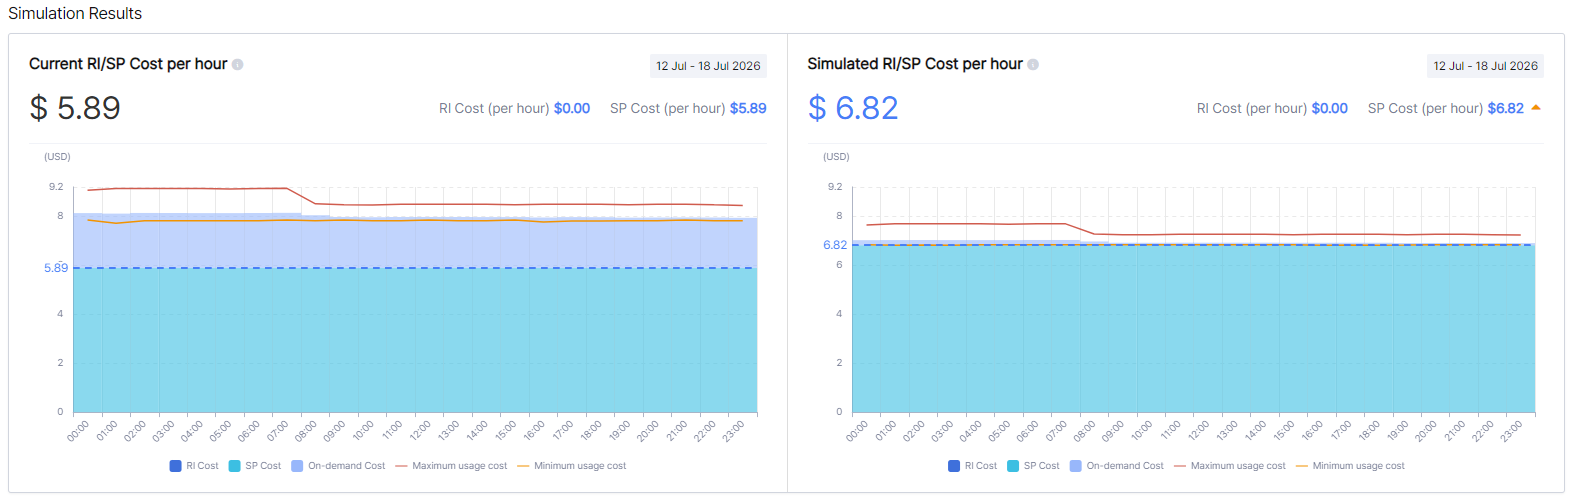
- Hourly RI/SP Cost charts — Compare the hourly RI/SP and On-Demand cost of Current vs. Simulated.
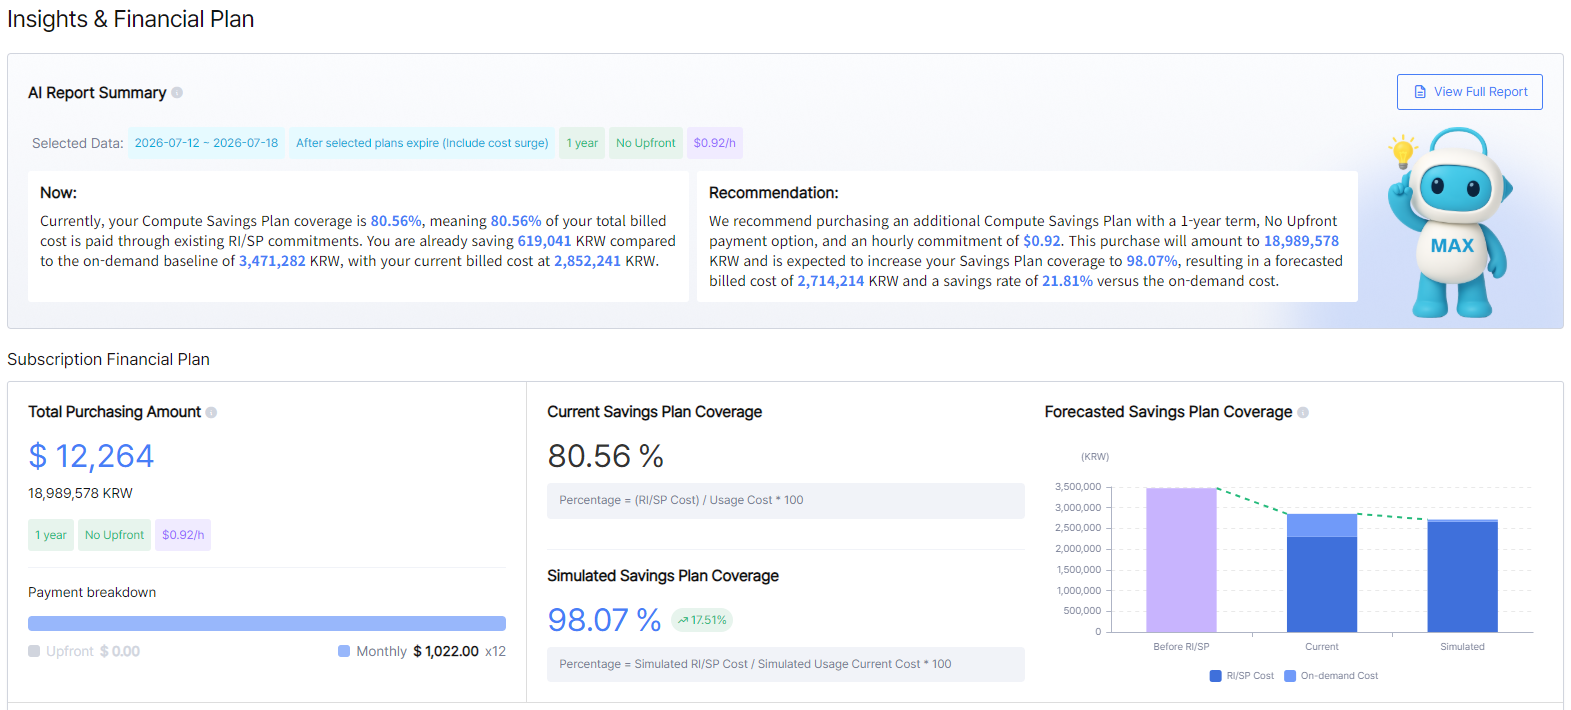
- AI Report Summary — AI summarizes the current status / risk / recommendation. Use
View Full Reportfor the detailed report. - Subscription Financial Plan — Provides the Total Purchasing Amount, the Current / Simulated / Forecasted Savings Plan Coverage, and the Payment breakdown.
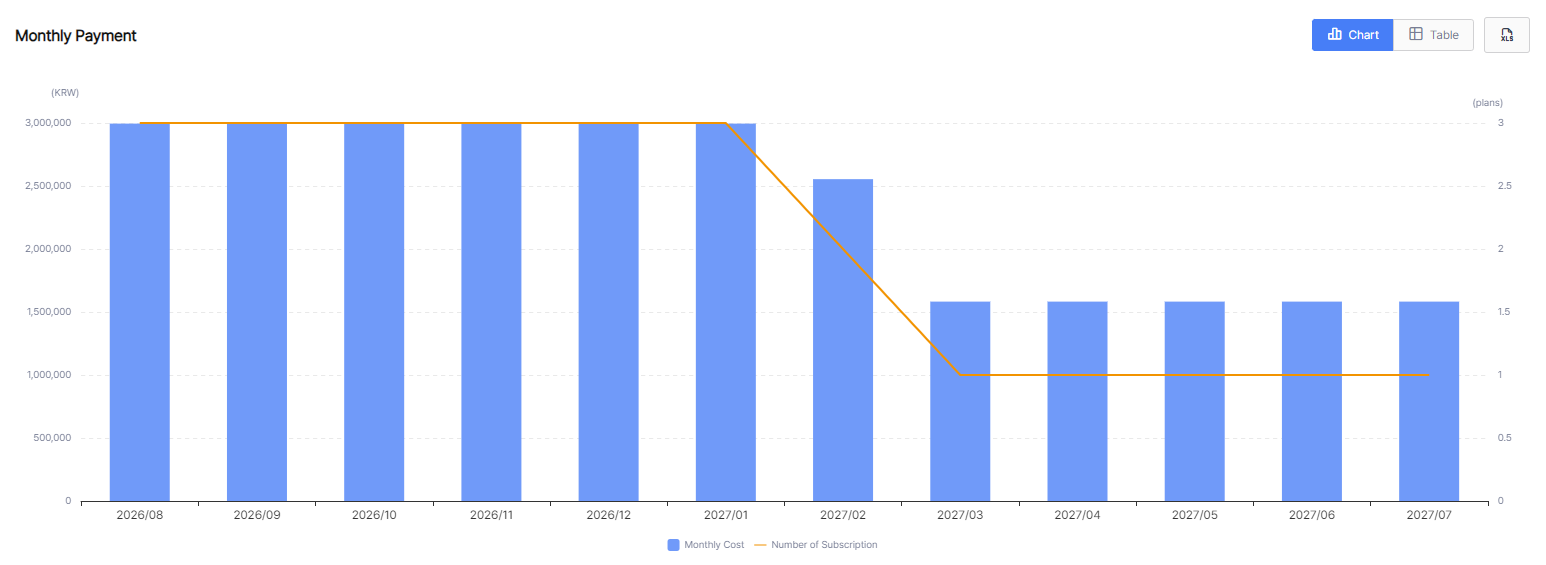
- Monthly Payment — View the projected monthly cost (current plans + new subscription) as a chart/table.
- Export Simulation Data — Download the summary and the raw data of the hourly charts as Excel.
Online consultation
Contact us